posted 02-21-2008 05:40 PM


For those who care.I've concluded that Zelicoff did not calculate his Monte Carlo Confidence intervals incorrectly, though I still get some interestingly different results at times.
Zelicoff's results with INCs as errors.
- NPV = 73% (62.5%-78.1%)
- PPV = 55.5% (45%-60%)
The replication results.

Here are his results, when INC's are not calculated as errors - this is the stuff he chose not to emphasize.
- NPV = 97% (92%-100%)
- PPV = 88% (82%-87%) its just a scriveners error (typo) in his report, as his CI doesn't include his mean - no way his spreadsheet calculated it that way
Here is the replication Monte Carlo. Its not far from his results.

I still think there is lots of room to criticize his decision to regard INC's as errors, using gaussian signal detection theory and the principles of significance testing. This argument is for me much stronger when we describe decisions in terms of alpha boundaries (type 1 errors tolerance) and not polygraph-centric point totals.
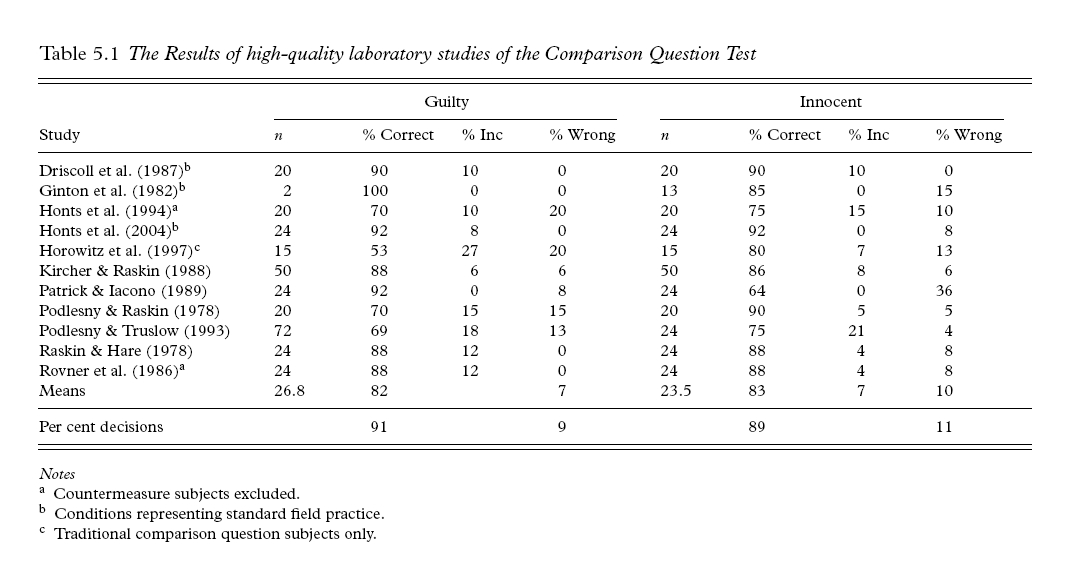
Here is a graphic of the results, of the same Monte Carlo experiment using a different
set of data, from Honts' chapter in Granhag's book (2004).


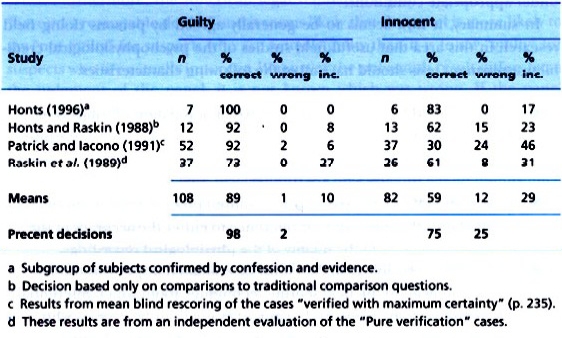
Aside from the specificity rate, this not very different from the Raskin and Honts in Kleiner (2002) data that Zelicoff used (below).

The big difference is that blasted Patrick and Iocono study, which used blind scores of RCMP data. To me the RCMP test structure is a bit of a hopeful mish-mash, instead of a test with a theoretical structure premised on conclusions from the study of data, but I don't really know much about the technique or the data.
later,
r

------------------
"Gentlemen, you can't fight in here. This is the war room."
--(Stanley Kubrick/Peter Sellers - Dr. Strangelove, 1964)


 Polygraph Place Bulletin Board

 Professional Issues - Private Forum for Examiners ONLY

 Zelicoff - argh!


